
Deficiency Performance Report
Want to know which issues come up most often—and where they’re happening?
The Deficiency Performance Report makes it easy to track how many times a specific inspection question has failed, and lets you drill down by time period and location to spot recurring problems.
Note: Deficiencies are Questions rated with a response option equal to 0% score (Fail).
This report will also display how many times the questions were answered with a 1-99% score (Needs Improvement) and a 100% score (Pass).
Only Account Administrators & Managers can generate reports.
-
When signed in to the system, click on the Reports tab in the left-hand menu bar. Once the menu is open, click on the Performance - Deficiency report.


- There are 2 versions of this report displayed at the bottom tabs of the report screen.
a. Deficiency Performance Report - displays the total count and average percentage of how often each inspection question has passed or failed. It also includes:
- Deficiency Trend Over Time - tracks the monthly performance of a specific inspection question by showing its average score by month, helping you identify patterns and changes in performance.
- Deficiency Trend by Location - shows how a specific inspection question performs across different locations, making it easier to pinpoint where deficiencies are most common.
b. Average Score Over Time - shows the overall monthly average pass rate (%) for all inspection questions combined, helping you monitor improvements or declines in inspection performance over time.

Deficiency Performance Report
There are 8 elements to this report:
a. Question - inspection question.
b. Question Count - the total count of how many times the question was answered.
c. Pass Count - the count of how many times the question was answered with a response option of 100% i.e., Pass
d. Pass Average - the calculated average percentage of the questions scoring 100%.
e. Fail Count - the count of how many times the question scored with a 0% response option, i.e., Fail.
f. Fail Average - the calculated average percentage of the questions scoring 0%.
g. Needs Improvement Count - the count of how many times the question was answered with a response option with a % of compliance between 1-99% i.e., Needs Improvement.
h. Needs Improvement Average - the calculated average percentage of the questions scoring between 1-99%.

(Note: To sort the data by ascending or descending order, click on the column title you would like to sort by in the report.)
Use the Search Question bar at the top right-hand corner of the report to search for a specific question.

The Pass Threshold% is located on the blue left-hand menu. Slide the Pass Threshold % range bar, or manually input a number to set the score you consider a “Pass”.
Scores at or above are displayed in green, and those below are in red.
(Note: The threshold will be set to 90% by default)

Deficiency Trend Over Time
Click on the Question you'd like to view and then click on the green Deficiency Trend Over Time button to view the monthly performance trend on that question.

Here, it will break down the average score for that question over a month-to-month period.
Click on the green Back button to go back to the report.

Deficiency Trend by Location
Click on the Question you'd like to view and then click on the green Deficiency Trend by Location button to drill down into the location performance results for the selected question.

Here, it will break down how the selected inspection question performs across different locations, making it easier to pinpoint where deficiencies are most common.
The Campus will be displayed by default. You can drill down further into each location node (Building-> Floor->Area->Room) by clicking right on the bar graph and then clicking Drill Down. Repeat until you get to the location node you wish to view.


Click on the green Back button to go back to the report.
Average Score Over Time
There are 2 elements to this report
- Average Score by Month (blue bar)
- Count of Questions by Month (red line)
Here you can view your average score trend to measure the compliance by month for all questions within the parameters selected.

-
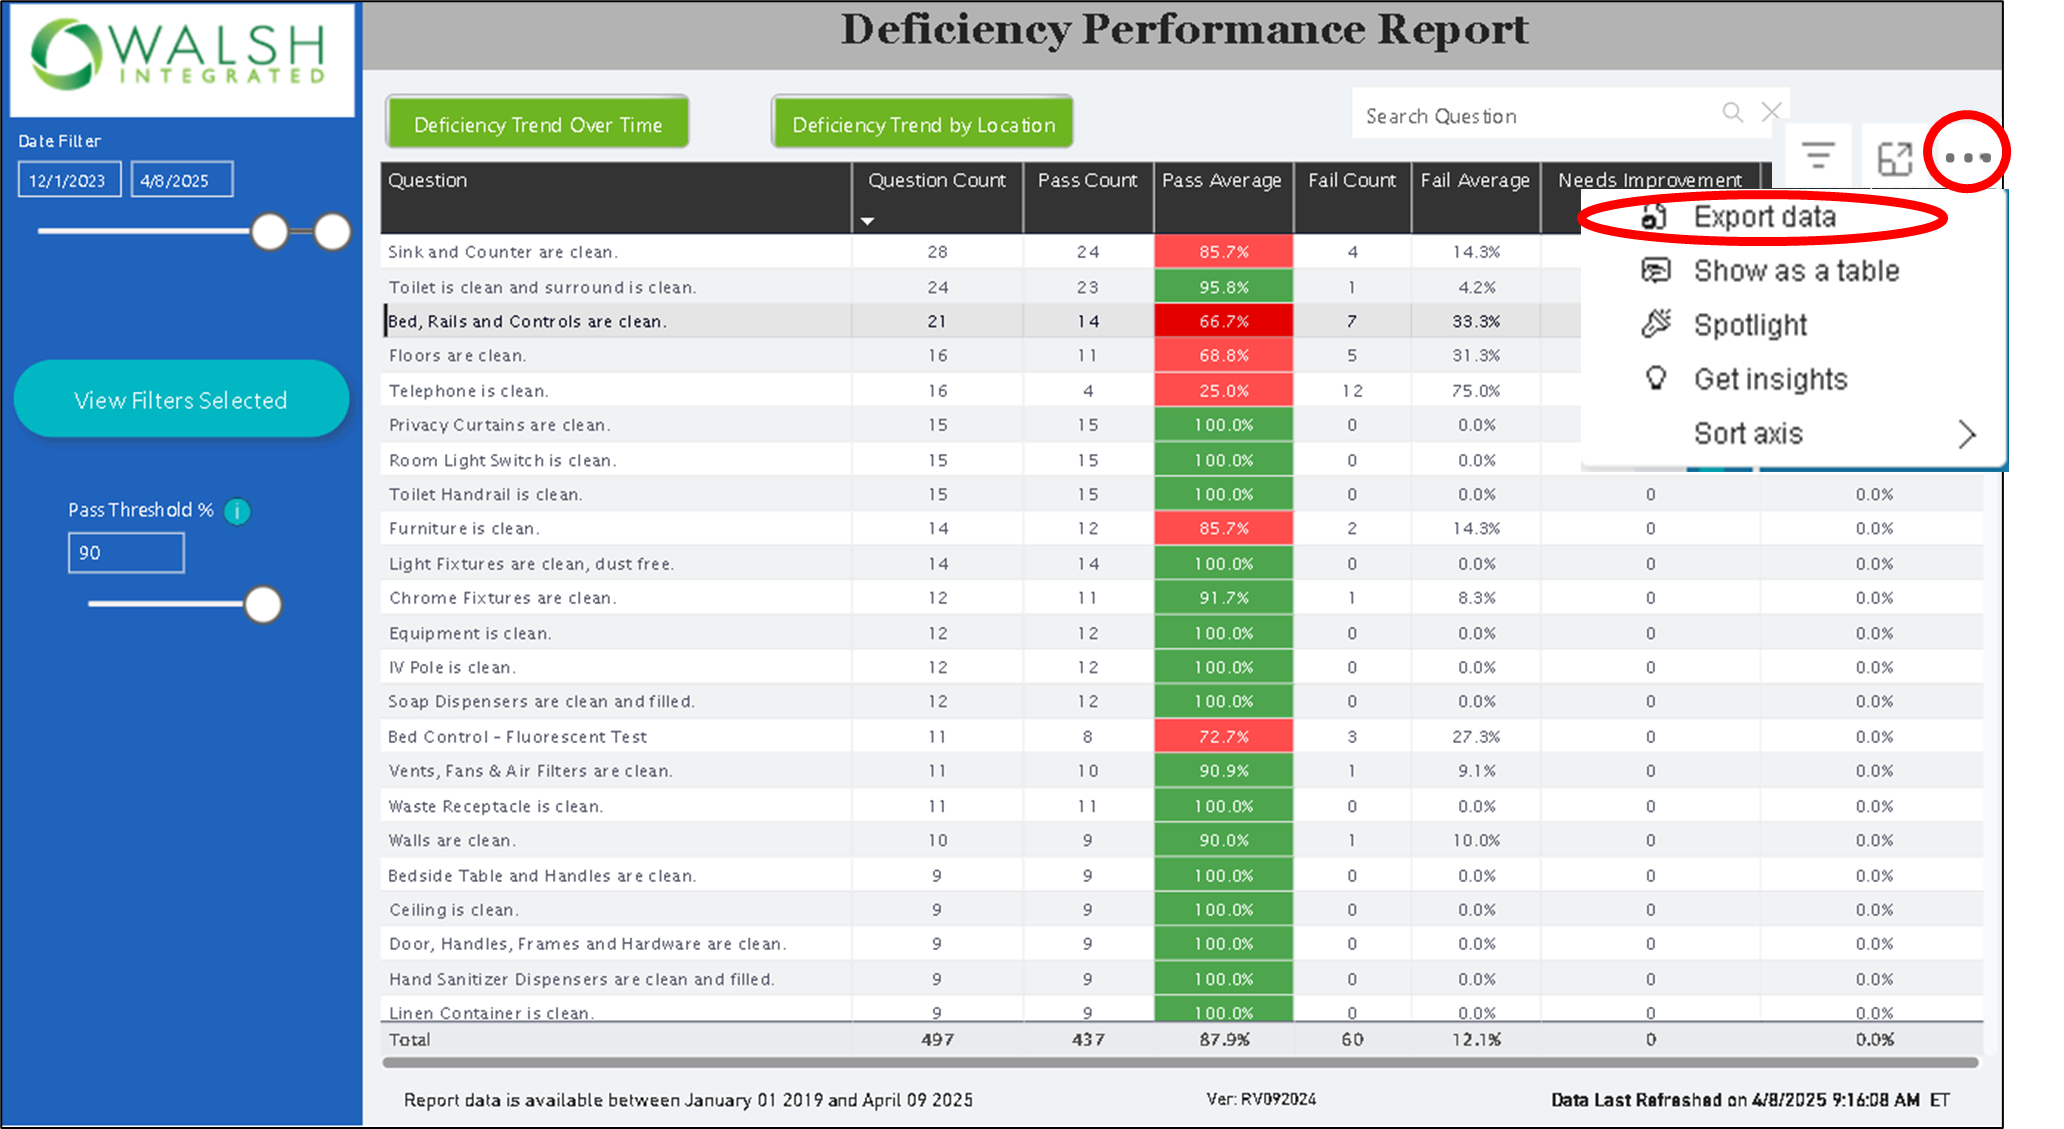
To export the report, click the "..." icon at the top right-hand corner of the report table and then click on Export Data.
-
To open the report in Full-Screen, click on the arrows at the top right-hand corner of the report.

-
To focus/expand on the report table, click the Focus Mode icon.

6. By clicking on the blue View Filters Selected button on the blue left-hand menu, you can filter on the following parameters
a. Date Range
b. Search Inspection ID
c. Evaluator
d. Operator
e. Assignment
f. Inspection Template
g. Location
h. Location Model (i.e. patient room, restroom, O.R., etc.)


The report data will update automatically as the filters are applied.

Summary
To see a summary of your deficiencies and how often and where they recur, use the Deficiency Performance Report.